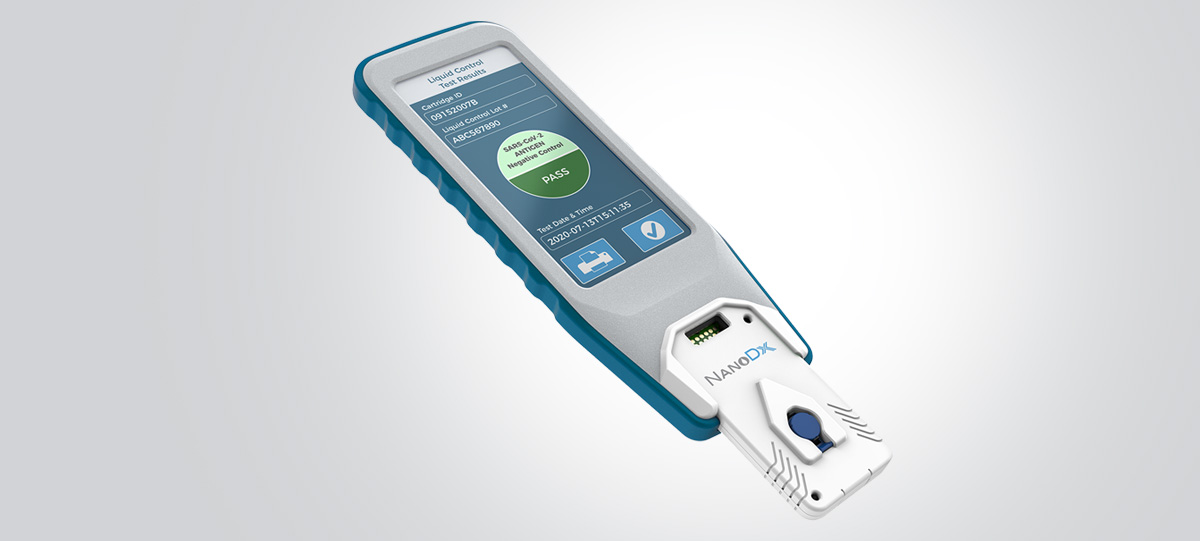
Ruggedized Design
NanoDx Analyzer
Getting Results, Faster
Our sense of sight is typically the predominant source of information during first encounters with something. This is because we can usually see things before we can smell, hear, touch or taste them. Vision is so powerful that we are able to make very deep assumptions about what to expect when our other senses are engaged.
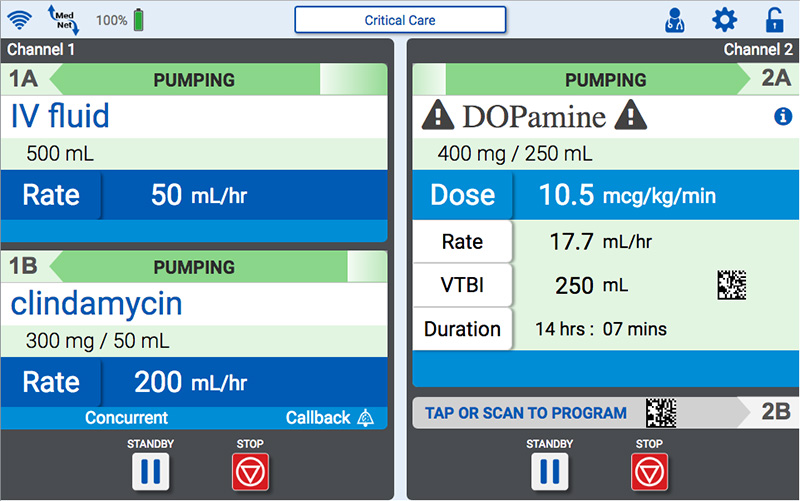
A graphical user interface is not exempt from this. If the interface looks complex or unappealing, there is an increased probability that users will be negatively biased on how usable it is and that will affect their actual use. In addition to creating bias, visual design has a direct effect on usability as users bring existing mental models they have developed in the past to new experiences. These need to be understood and reinforced in both visual and user experience designs where possible and beneficial.
The visual design is the ‘skin’ or ‘window dressing’ on the underlying framework defined in the wireframes. Color palette, shapes, styles, iconography and patterns are all carefully balanced to create a theme that when used consistently, supports predictability and user comprehension through visual stimulus.
Visual design is a highly subjective aspect that encounters competing personal preferences. As such, it is not uncommon to have several rounds of iteration on design concepts at each phase.
The Eclipse user interface design process includes fully documented interactive behavior, layout, typography, and branding. These artifacts, along with all visual design assets, are created to meet the specific needs of your product management and development teams.
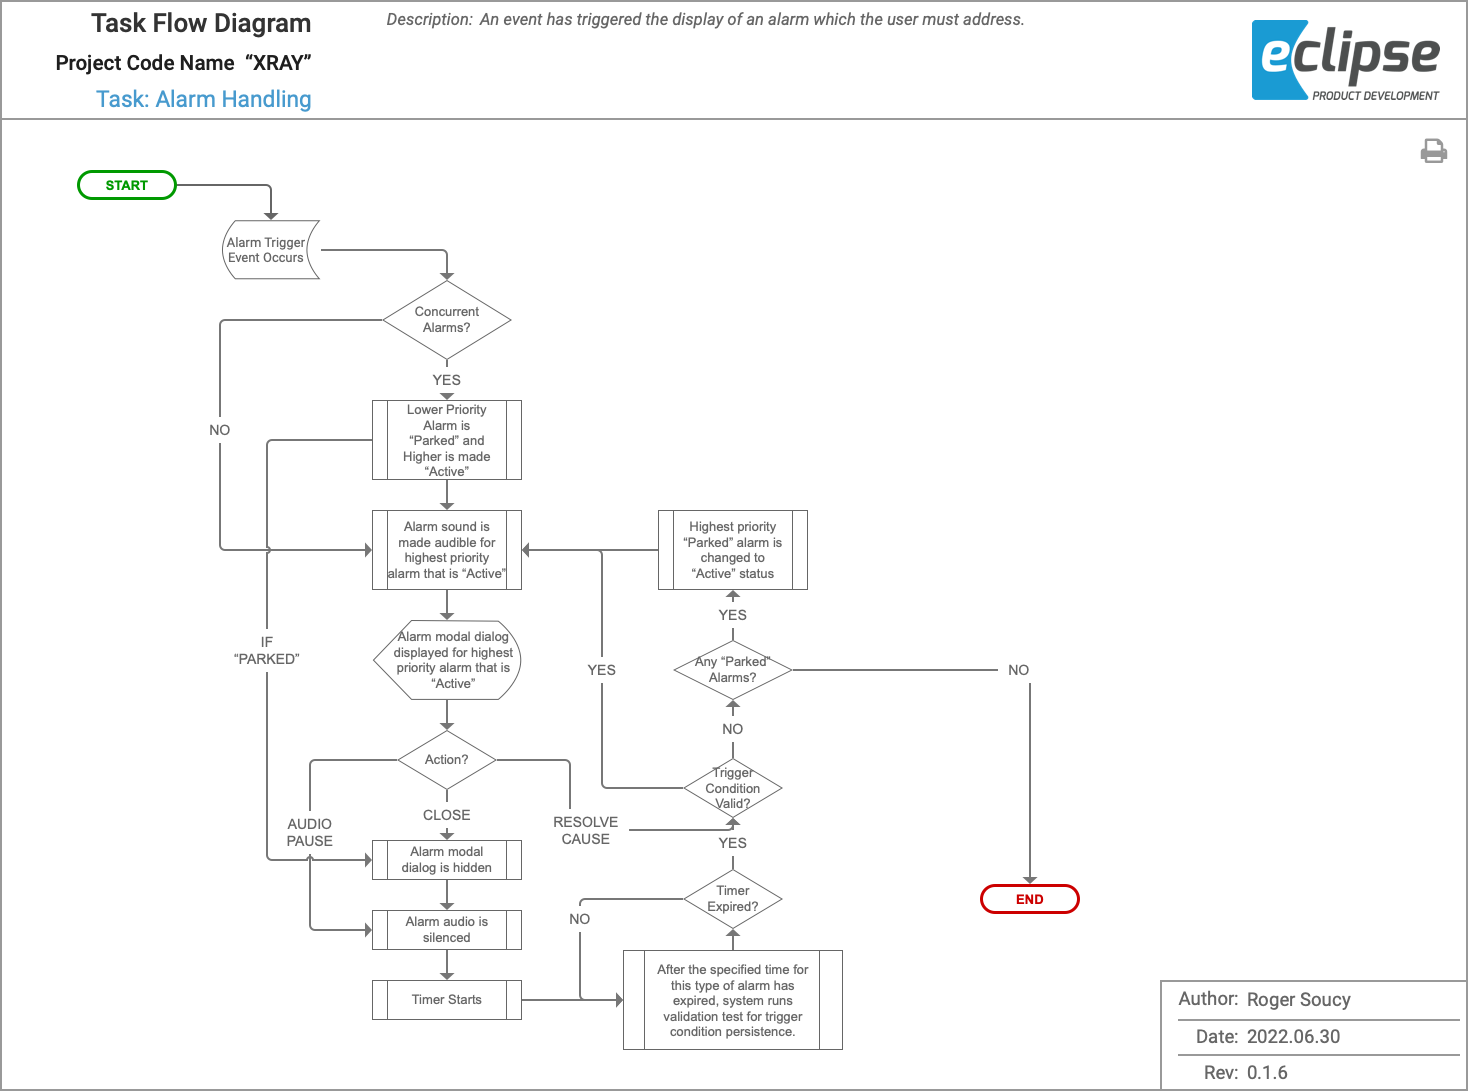
While flow charts don’t usually win popularity contests, their value is immense when it comes to designing a good user experience.
Task flow diagrams provide the foundation for designing interaction models and creating wireframes. Additionally, they are beneficial to development teams for coding conditional behavior in system logic.
These diagrams break down each task into its individual steps from beginning to end. They map out all available options, decisions, and results which provides a focussed view of the underlying logic and navigation of a user interface. Through this, pitfalls are exposed early and changes to the user and system behavior can be made faster and easier – before design and development start.
Whether it’s inconsistencies in similar actions, unwanted decision loops, or extra work to achieve a goal, task flow diagrams are a very effective way to discover and resolve issues early and improve the user experience as a whole.
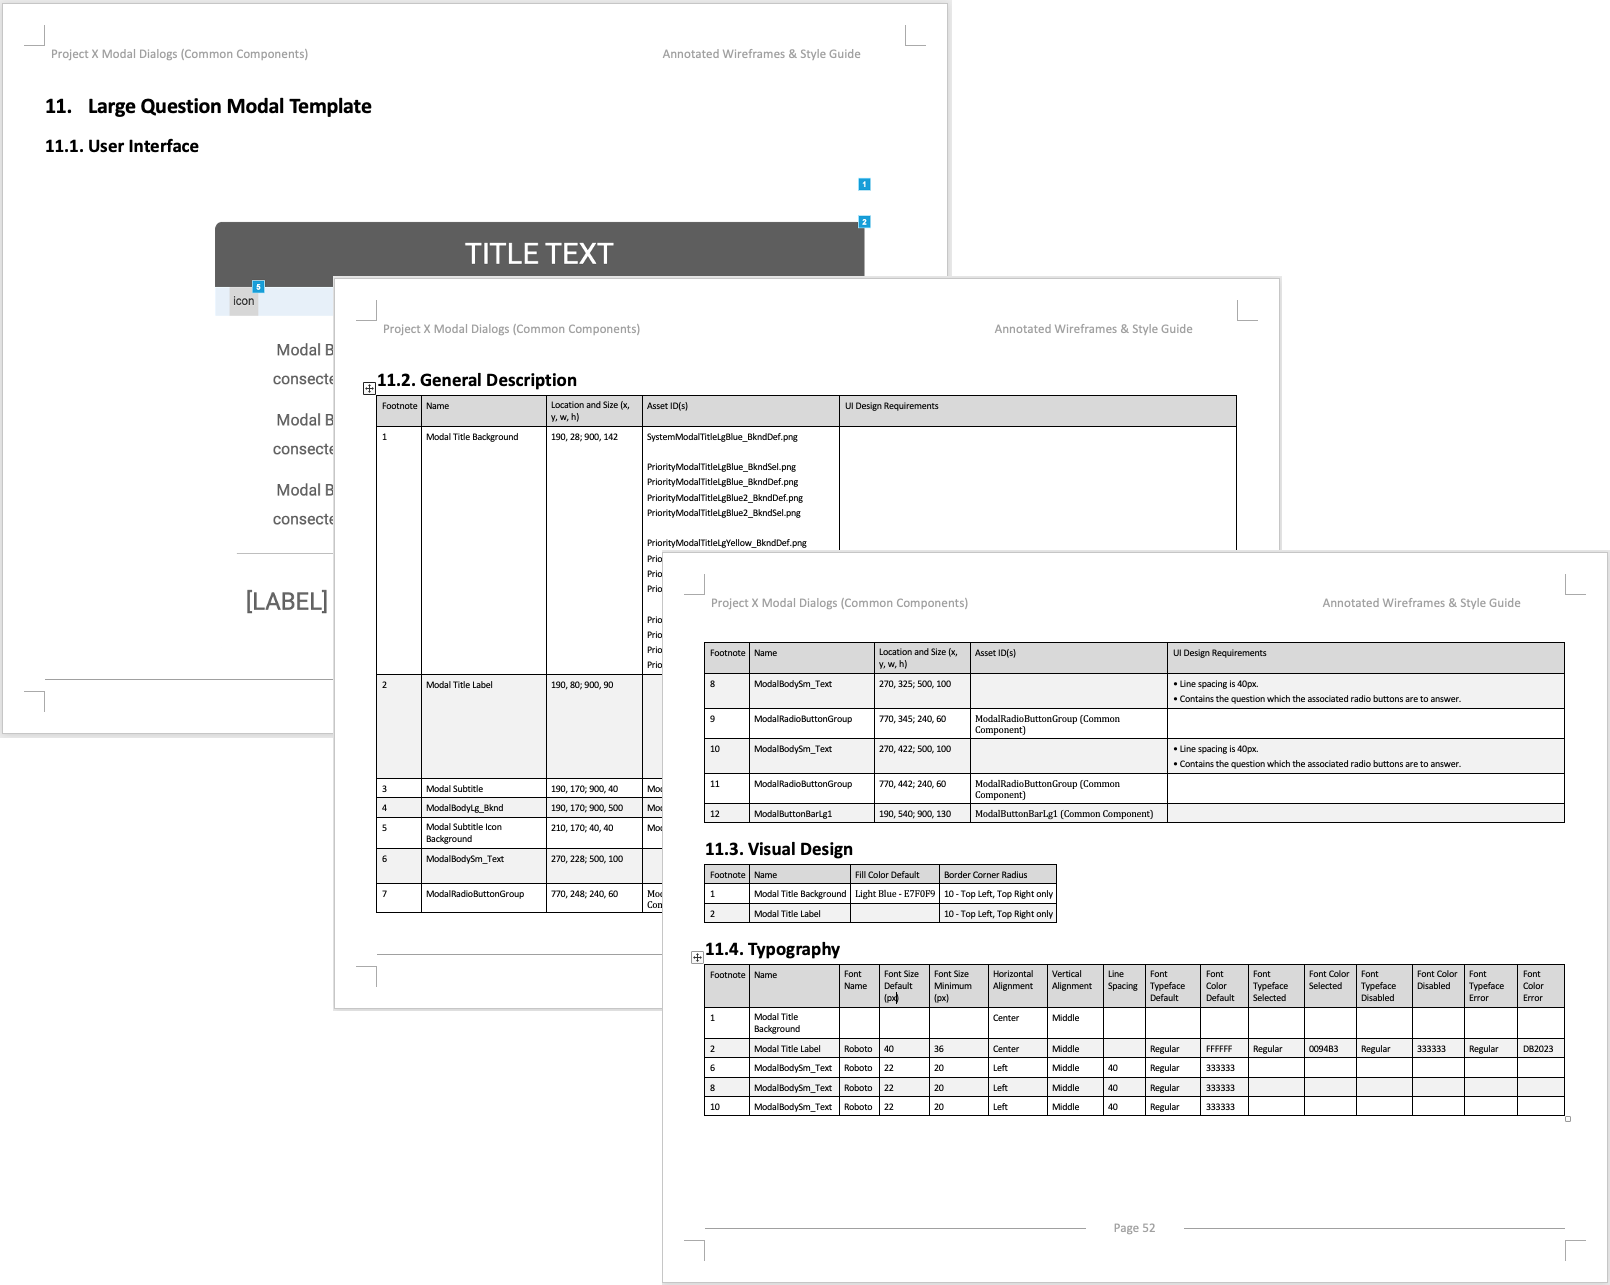
Before interior design and window dressing is added, blueprints are what guide the construction of the framework for a building. Wireframes are just that for a user interface. A low-fidelity layout showing each of the elements’ size and position in the user interface along with detailed definitions on what, when and how they behave.
Avoiding the distraction high-fidelity visuals bring allows the wireframes to maintain focus on the essence of what the user interface contains and how it works. As the project progresses, other aspects will be annotated such as visual design and typography in order to support creation of a style guide.
Wireframes are the gateway into realizing how the output of task flow diagrams can be handled through the user interface. They are very effective at supporting evaluation of the design. This is because they express everything necessary, while eliminating the bias that visual design aspects such as like colors and styles can introduce which interferes with the goal.